Hive API node performance measurement
This post describes the [Jussi Traffic Analyzer](https://gitlab.syncad.com/hive/jussi-traffic-analyzer) software that we created to measure the performance of our production Hivemind node and some of the results we’ve recently obtained from it.
The intended audience is mostly Hive apps developers and API node operators, but if you're like me and sometimes you like to read something very techy even though it's hard to understand (I used to do this with Scientific America articles when I was kid), feel free to enjoy as well.
It’s important to note that this tool analyzes Jussi log files, so it’s not really useful for measuring third party API nodes (unless the node operator is willing to provide you with their logs, which is probably doubtful).
The tool generates two reports over any specified period of the log files:
* `analysis.csv` which contains statistics on the different API calls
* `slow_calls.txt` which contains actual calls that exceeded a specified time to complete (for example > 2 seconds)
# Overview of API call statistics file (analysis.csv)
The data in slow_calls.txt is self-explantory, so I’ll spend most of the time in this post discussing the format of the analysis.csv file.
Each row in the analysis file represents a specific type of API call (the first columns, there's actually 3 columns, although I only show one in the screenshot to keep it readable, identify what this API call is).
One thing to keep in mind, however, is that a single type of API call can result in quite different SQL queries inside hivemind, depending on the parameters passed to the call, so there’s still a lot of data being “averaged” together in this report. For example, the time required to make a call to get_ranked_posts can vary a lot depending on whether you’re asking for ranked by trending, hot, etc. Nonetheless, I think this data can still be quite useful for obtaining some intuitive feeling for the times required by various calls.
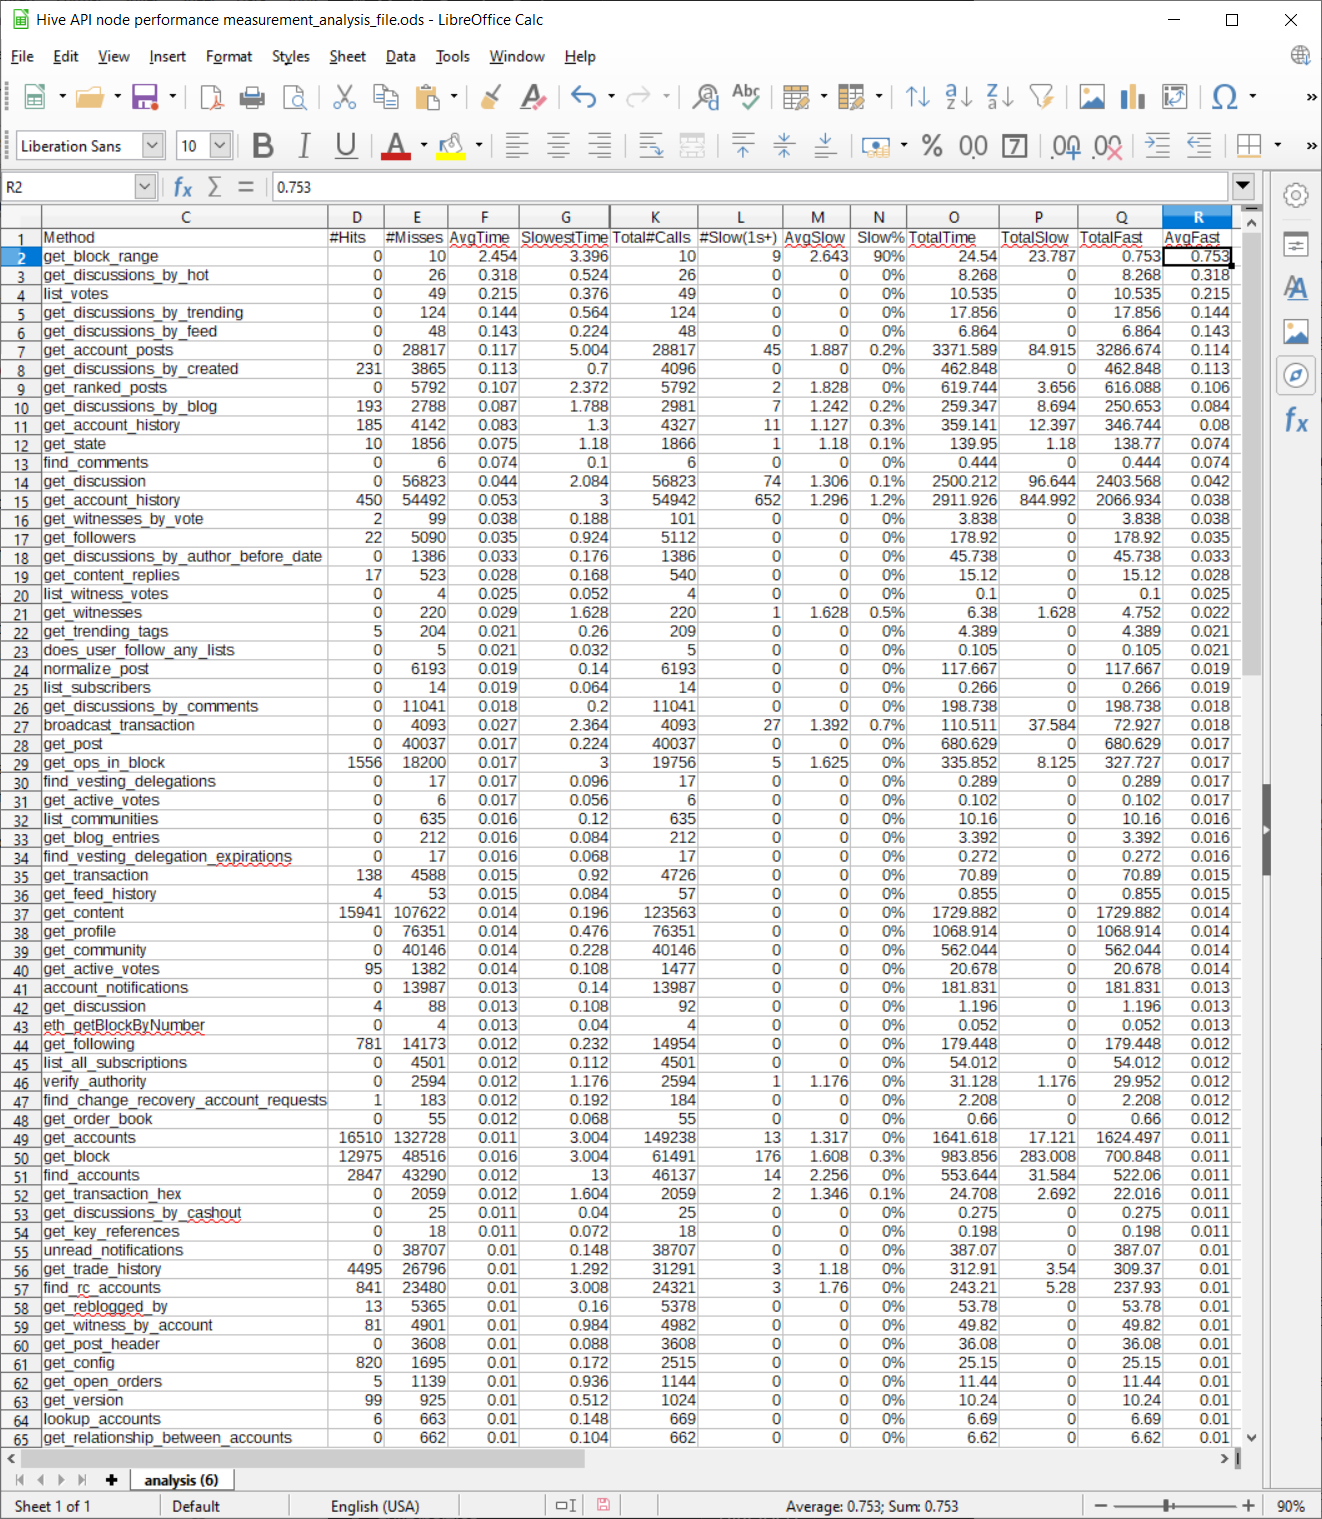
Here’s a screenshot of a sample analysis file (I’ll make the raw data file available in the mattermost Hive dev channel later today). This data was taken today from our production node over a two hour period, running with our latest hivemind optimizations. Note that this screenshot doesn’t show all the columns in the raw data file, I’ve selected ones of particular interest to discuss in this post.
* Hits is the number of jussi cache hits. Cache hits are generally low, because parameter values vary a lot and also because many of the responses to API calls change quickly (votes, in particular, can change the results for many API calls). So this data is mostly useful for optimization work when you're able to change the API itself.
* *AvgTime* is the average time of all the API calls of this type.
* *SlowestTime* is the slowest time recorded during the analysis period for this API call.
* *Total#Calls* is the total number of calls to this API node of this type of API call during the analysis period.
* *Slow(1s+)* is the total number of calls to this API node of this type of API call during the analysis period that take 1 second or more to complete.
* *AvgSlow* is the average time of such slow calls (so it will always be greater than 1s).
* *Slow%* is the percentage of the total calls of this type that take more than 1 second to complete.
* *TotalTime* is the total time consumed by adding up all the calls made for this API call. For example, if there were 100 calls and each one takes .1 s, then this value would be 10s.
# Some notes about using these metrics
I use *TotalTime* to measure the overall loading impact of a particular type of API call on the server, although there are some exceptions to this rule, such as broadcast_transaction_synchronous, which has to wait for a block to complete so that the transaction can be included in a block, but doesn’t consume CPU while waiting. This is the single most important metric for determining how well a node can scale to handle more traffic.
I use *SlowestTime*, *Slow*, *Slow%* to investigate potential quality of service problems that might affect user experience (users don’t generally like to wait long to see results).
*AverageFast* is useful for knowing what you can normally expect from an API call when you exclude “outlier” calls that access “unusual” data (for example it would exclude timing data from a post with many thousands of comments). So this is a very useful metric for apps developers.
# Notes on the sample data
After generating the two reports with the Jussi Traffic Analyzer, I import the analysis file into LibreOffice Calc or a similar spreadsheet program to analyze the data, then use AutoFilter so that I can sort on different columns.
In the screenshot shown, I’ve sorted by *AvgFast* time, and we can see that the API call that takes the longest time on average in all cases and in the “fast” case is `get_block_range`. This API call is served by hived, not hivemind, and you can see that it takes considerably more time than the average API call (the average “fast” time is .753s and the average time overall is 2.4s!).
One of the objectives of our work with the hived plugin that will feed data directly to a Postgres database is to speedup this time by having hivemind, rather than hived, serve this API call in the future (and not coincidentally, reduce the loading caused by hivemind sync time, because currently hivemind makes this call to obtain sync data from hived).
# Using pghero to supplement analysis of node performance
In addition to the Jussi Traffic Analyzer, I also use pghero, an open-source web-based profiling tool for Postgres databases, to directly analyze the impact of various queries within hivemind’s database.
Pghero is particularly useful in isolating problematic SQL queries when a given hivemind API call is implemented using multiple SQL queries (either serially or by branching between possible query choices, which is quite common).
However, pghero can only report on times spent in database processing, so the Jussi Traffic Analysis tool is still very important for measuring overall performance, including the time spent by the python-based `hivemind server` process that communicates with hivemind’s database. And it can also measure the performance of hived-based API calls, which pghero cannot, since the processing of hived API calls doesn’t involve Postgres queries.